


Video Analytics and Controls
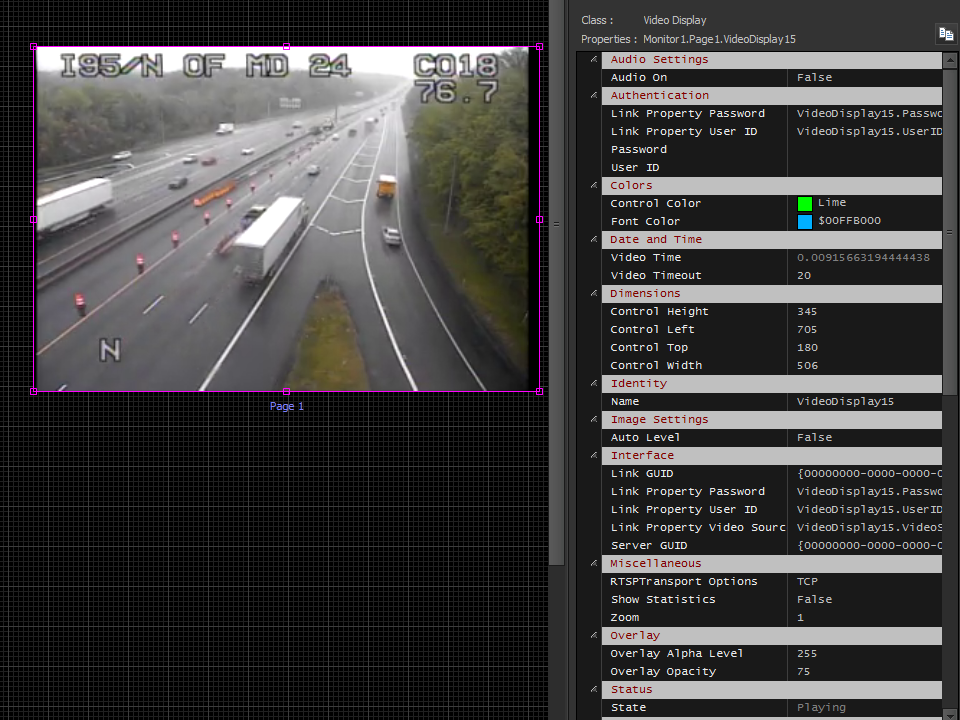
The video analytics and display controls are extremely powerful combining both surveillance and statistics gathering functions. The display panel has over 45 properties to configure the image characteristics for user interfaces or display walls. These include real-time image enhancement, conversion to monochrome for enhanced overlay contrast, clip recording, size and position, border size and color, padding and many more. There are several overlay controls that can be dropped onto the base class display to add functionality such as object detection and textual content.
The video analytics driver provides the real-time statistics and recording functionality for both surveillance and traffic analysis. For surveillance applications, the driver can be configured to record clips when either motion or objects are detected. When using object detection, you can optionally set count limits which is useful for monitoring areas that should not contain more than a certain number of individuals (e.g. a record room). These can be driven by schedules to only record or alarm during certain hours. Additionally, alarms can be sent from edge servers running the video driver to a central Limelight XE master station / command center and automatically launch procedures and scripts as required.
For traffic analysis, the video driver can be used to count objects (e.g. people, vehicles, etc.) and log the counts on a per minute basis. Additionally it can create heat maps over time to show areas most traveled (see the images above). This is common practice for marketing firms to analyze where to place signage or product displays for maximum effect. By using existing security cameras in shopping centers, malls or small businesses, heat maps can be generated to better understand customer traffic. Road way signage can also benefit from traffic analysis by utilizing a camera and video analytics to dynamically change the sign's detail depending on vehicle density (how many cars can see the sign at once indirectly indicates traffic speed). For example, if cars are closer together, more detail could be displayed since cars are moving slower - less cars indicate lower density traffic and signage could adjust to less detail and larger images.
Applications can include typical video surveillance, monitoring industrial equipment, dynamic road signage, traffic analysis... the possibilities are endless. A high performance computer running this driver can typically support 8 to 16 cameras each depending on settings and data analysis requirements. All data is stored to SQL database tables for use by other display components in Limelight XE (via Limelight Interface Architect and Display Client) or third party or custom applications.